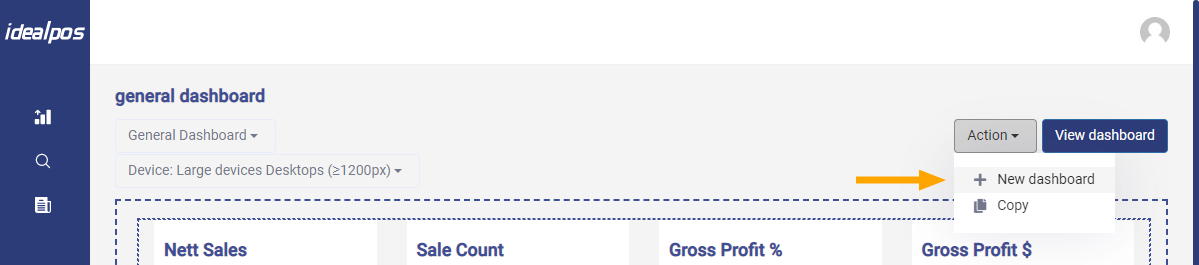
To create your own dashboard, click on the Action menu and select 'New Dashboard'
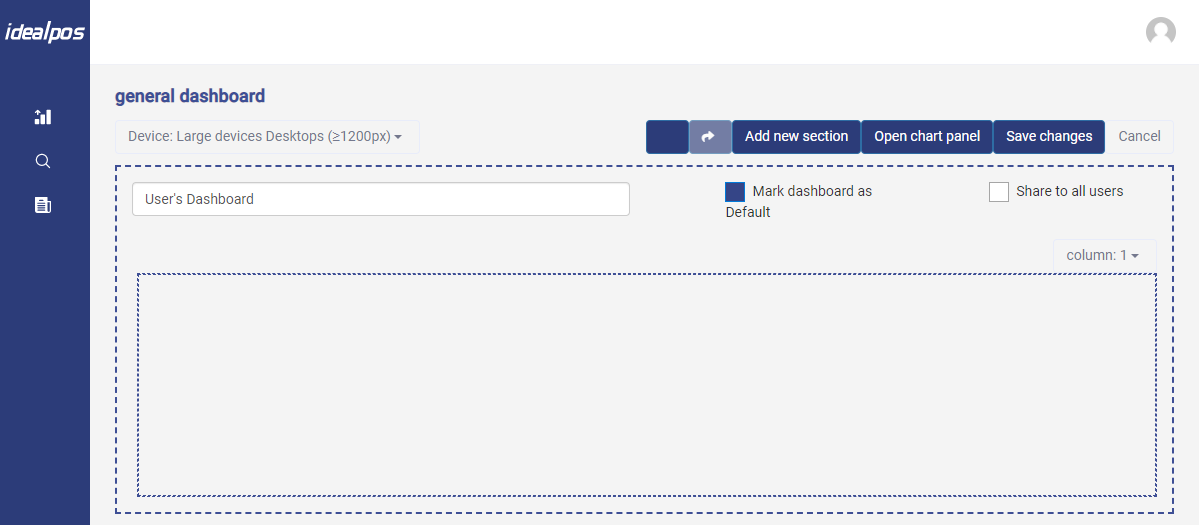
Then enter a name for your Dashboard.
You have options to 'Mark dashboard as Default' as well as 'Share to all users'.
When you tick the 'Mark dashboard as Default' option, the dashboard will become the default dashboard and will be displayed as the main dashboard when logging into Idealpos Online.
Ticking the 'Share to all users' option will allow other users to see your dashboard and use it. If you share the dashboard with other users, they will only be able to view and use the dashboard. Other users won't be able to delete your dashboard or make changes to it.
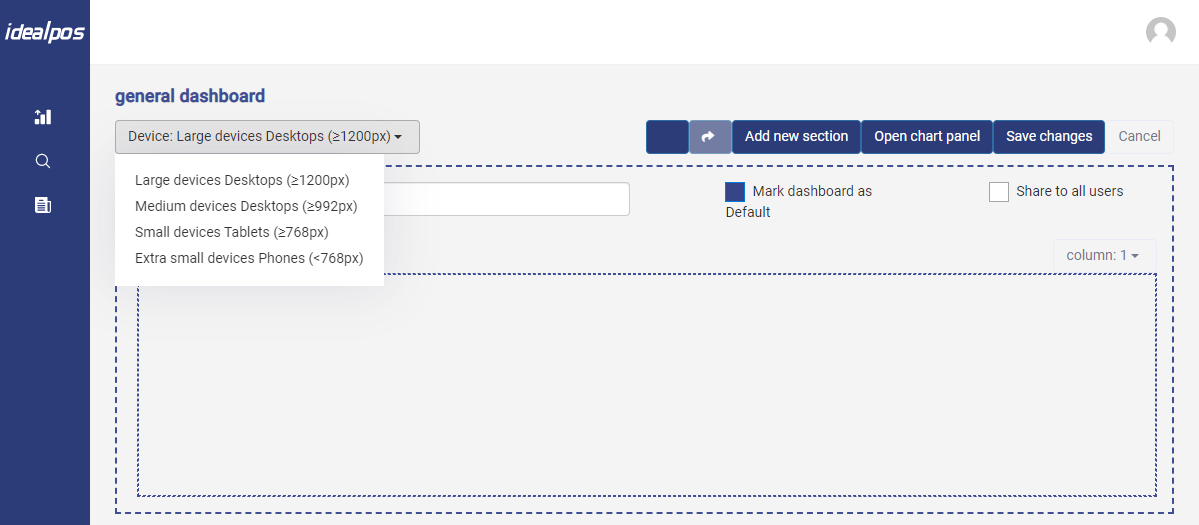
Select the Dashboard size that you want to create.
Note that the Dashboard size you create is only visible on devices, screens or browser windows which match or exceed the resolution.
E.g. You can't view a dashboard created for Large devices Desktops (1200px) on a small phone device or a browser window that is smaller than 1200px.
Also note that when you create a new dashboard, you can create a layout for each of the device sizes in the list (i.e. Large devices Desktops, Medium devices Desktops, Small devices Tablets and Extra small devices Phones). That way, the dashboard will look exactly how you want when you view it on any of the screen sizes available in the list.
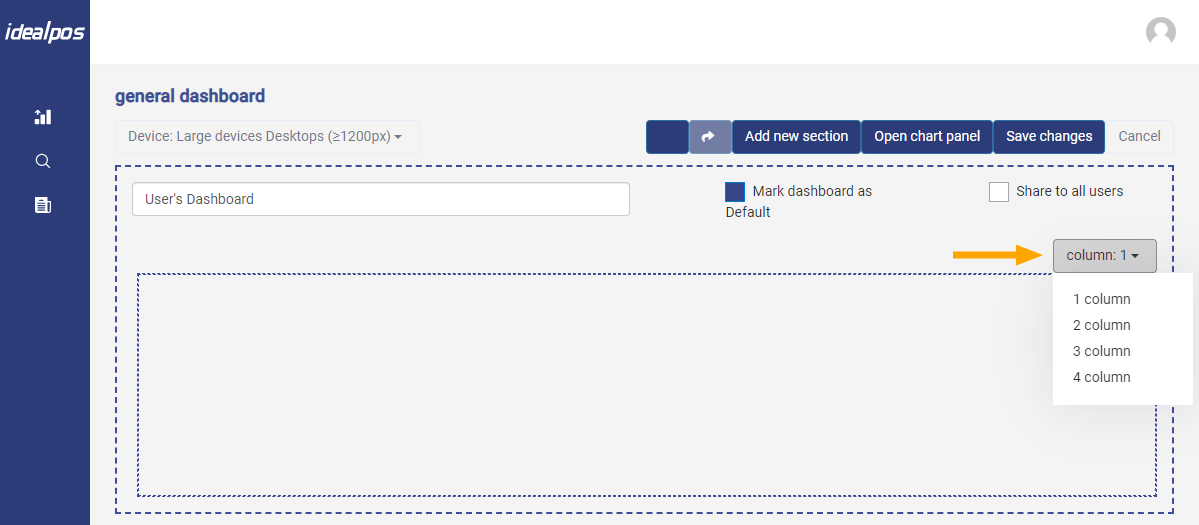
Select the number of columns you want to have in your dashboard.
The purpose of Columns is to arrange the same size charts.
You can work with one column and still have 4 charts which will look the same. Having one column will allow you to change the width of the chart.
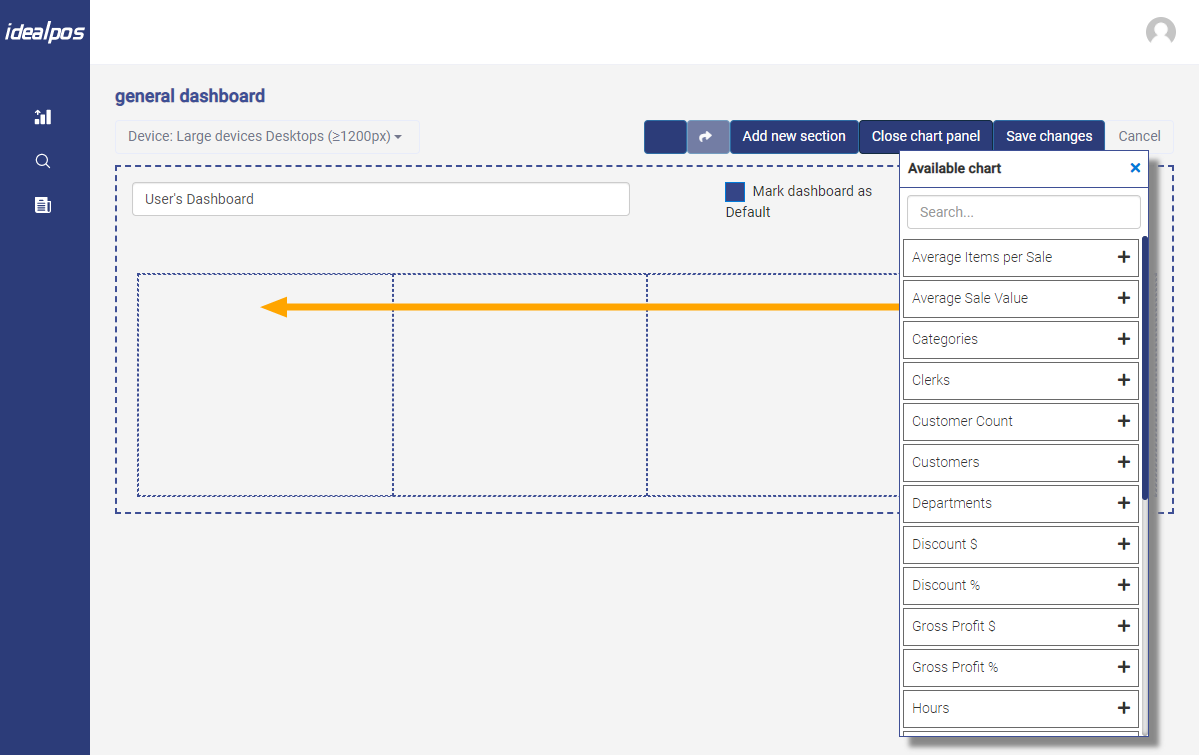
To display the list of available Charts, click on the Open chart panel button.
To add a chart to your dashboard, drag and drop the chart into the desired position or you can alternatively click on the + button next to the chart name.
You can also search for a chart by clicking in the 'Search...' box and entering a chart name.
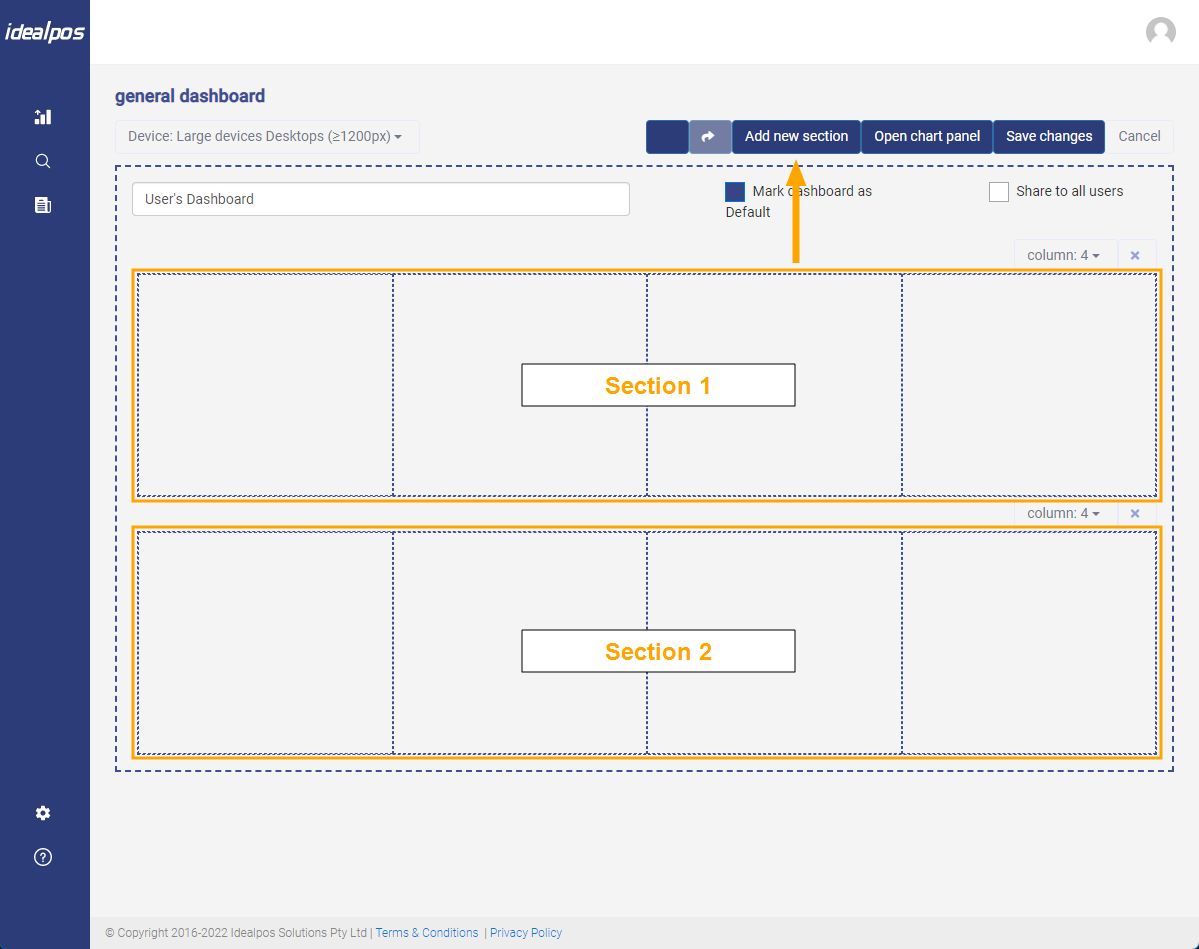
Sections can be added by clicking on the Add new section button.
You can then choose how many columns are in each section by selecting the desired number of columns.
Charts can then be dragged into the desired columns.
Once you have finished creating your dashboard, press the 'Save changes' button.
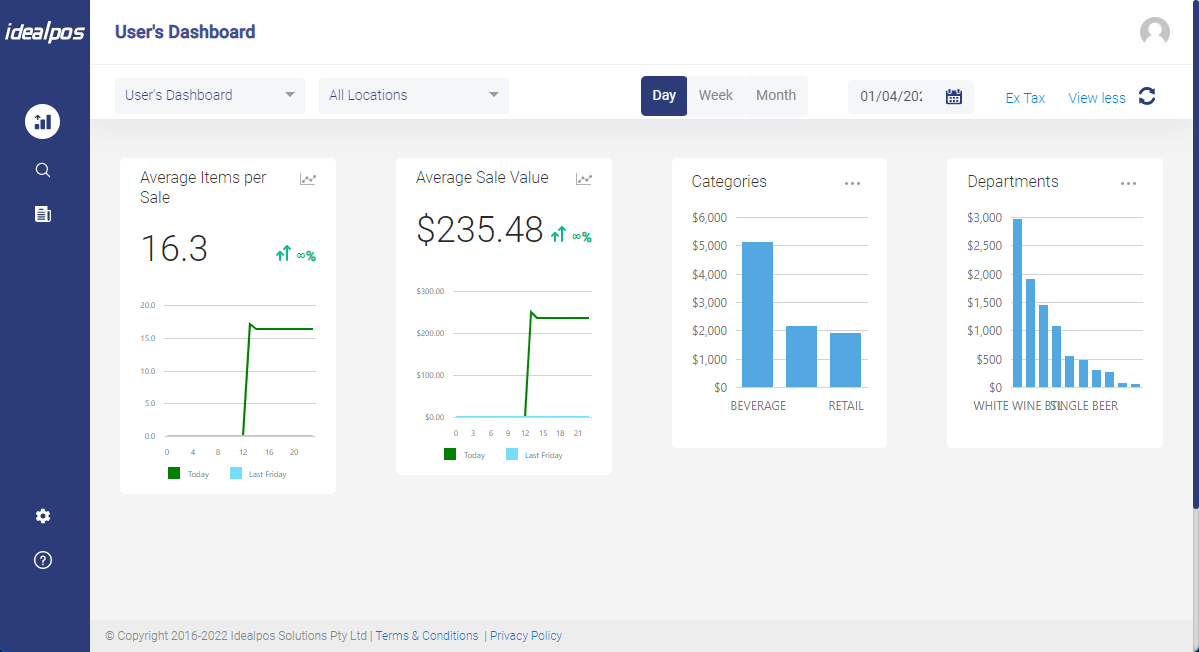
The new dashboard can then be viewed by clicking on the Dashboard menu, then selecting your dashboard from the list.
Note that when viewing your dashboard, ensure that your web browser size is larger than the dashboard size, otherwise you won't see it.
I.e. You can't view a 1200px dashboard on a 800px screen resolution.